[AWS][Elasticsearch]API Synthetics Monitoring工具的简单比较
针对API Synthetics Monitoring (主要是Endpoint Uptime), 可以选择Elastic的Heartbeat或者AWS新推出的Cloudwatch Synthetics Canaries.
AWS Cloudwatch Canaries
定义如下即可:
- Method: GET/POST
- Application or Endpoint URL
- Headers Key Value Pairs
- Request data
它会提供一个js的runtime, 新建一个lambda来跑,因而可以定义它所在的VPC, Subnet和SecurityGroup - Data retention period
- Data storage, 其实就是S3。默认自动生成。
- IAM role, 默认自动生成,也可以使用existing role, "need your permission to put artifacts into S3, and to store logs and publish metrics to Cloudwatch. Please specify an IAM role with those permissions."
- 可以设置Cloudwatch Alarm和SNS topic
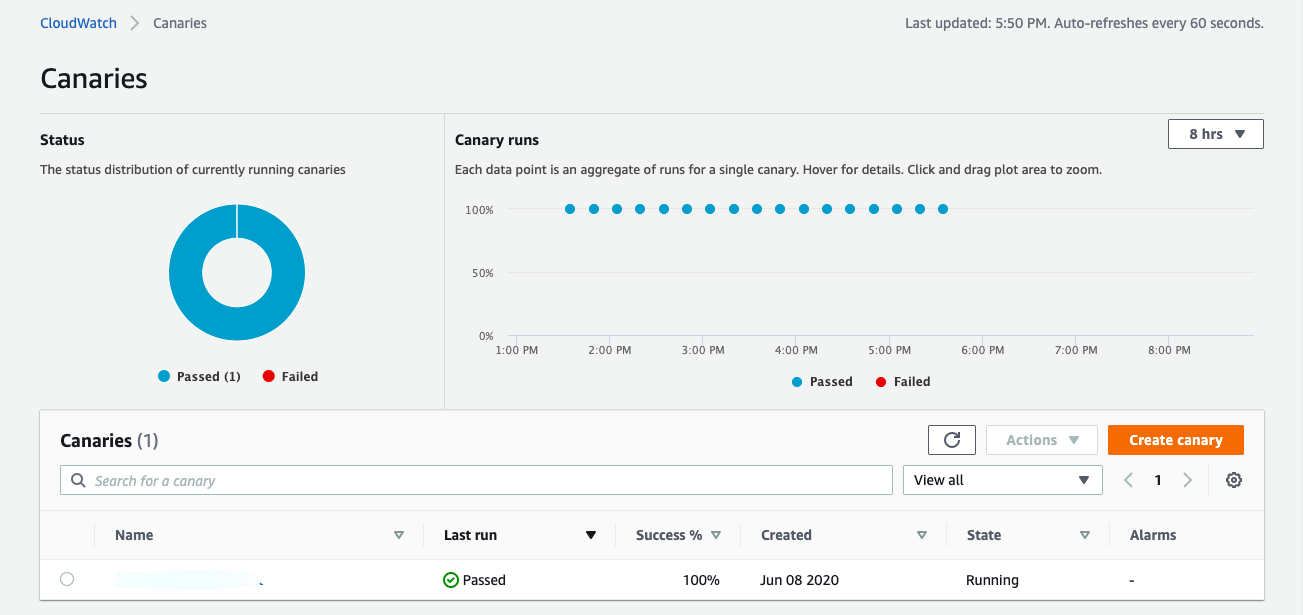
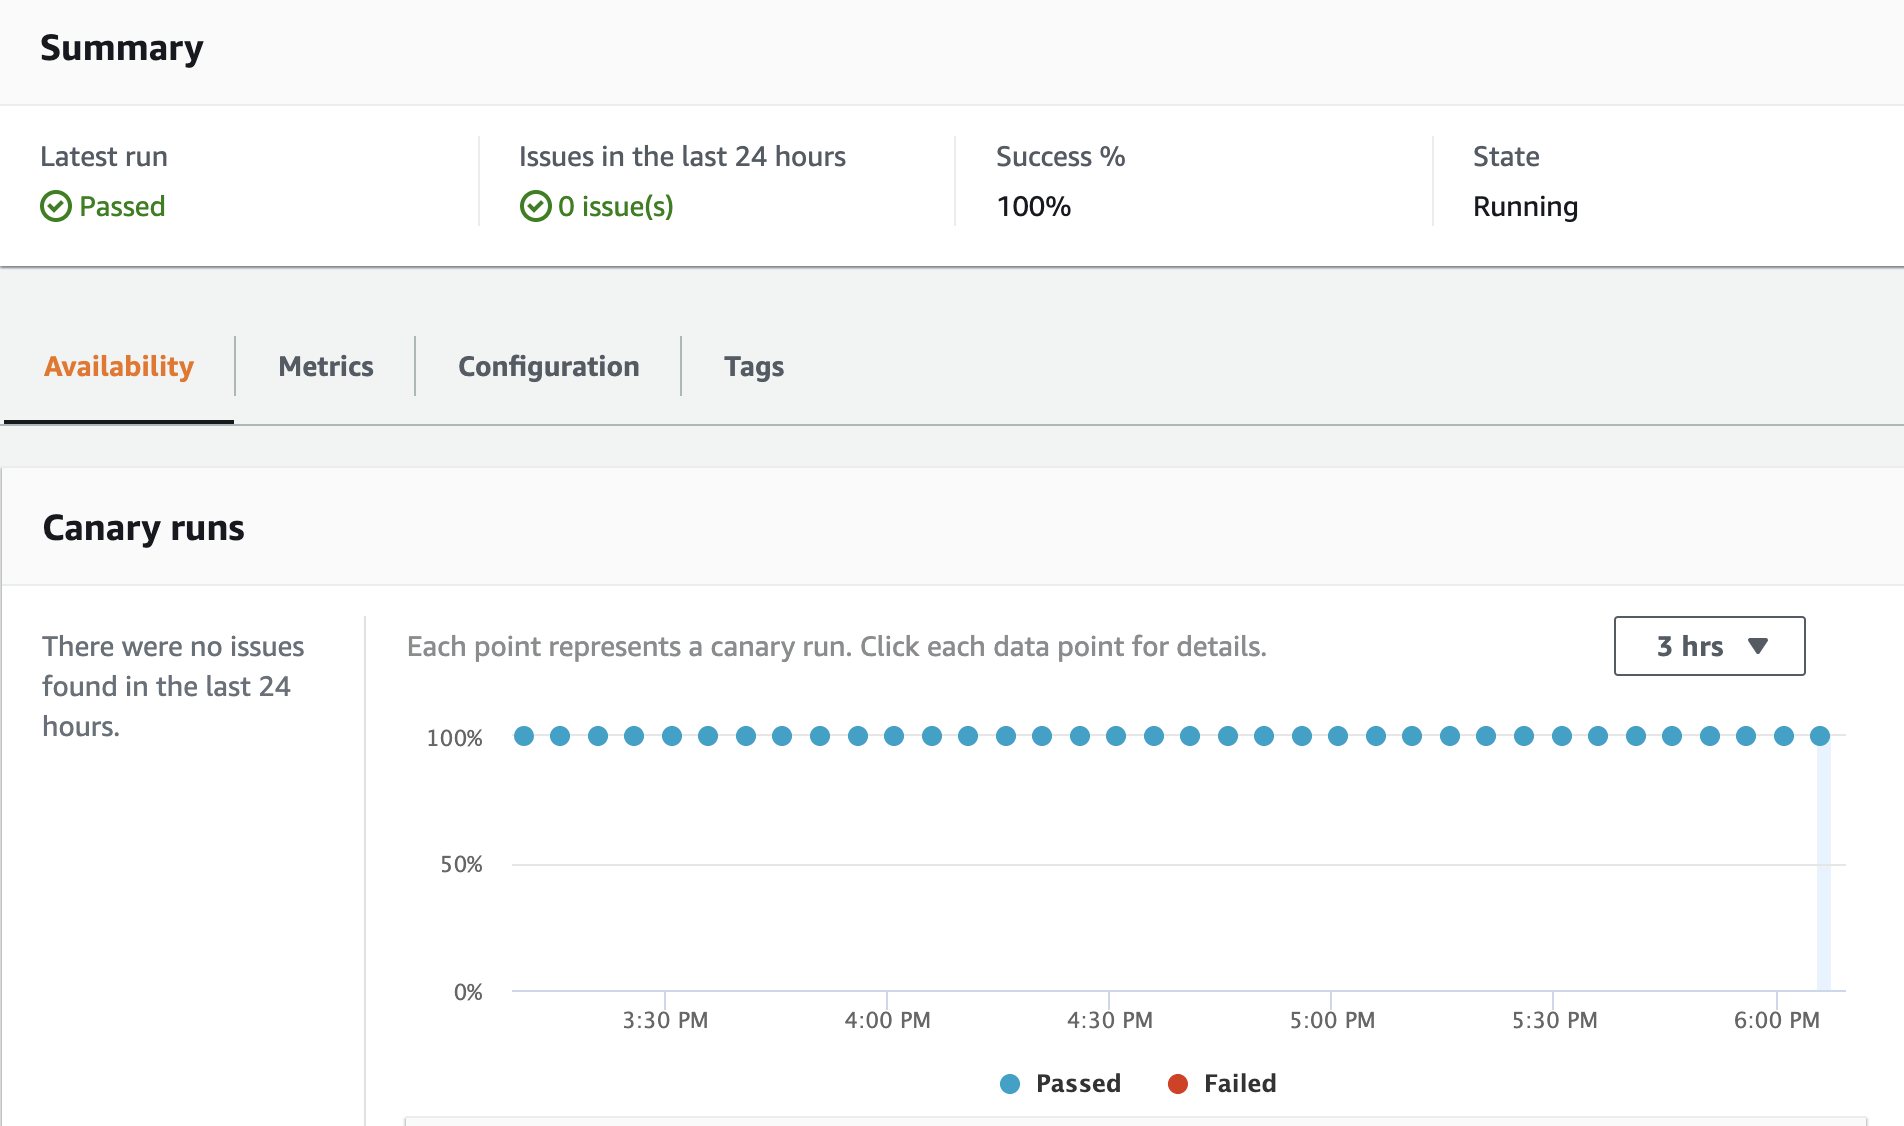
部署后效果如下:
我感觉有吸引力的点:
- 可以用CloudFormation来整体codify这个过程,方便管理;(Update 20200704:也略小麻烦,参考后续的实践)
- 可以监控private internal endpoint
For internal endpoints on Amazon VPC

For internal endpoints on other VPC providers or firewall setups

Elastic Heartbeat
它支持icmp, tcp, http协议,配置示例如下图, 同时 'The tcp and http monitor types both support SSL/TLS and some proxy settings'.
# heartbeat.yml
heartbeat.monitors:
- type: icmp
  id: ping-myhost
  name: My Host Ping
  hosts: ["myhost"]
  schedule: '*/5 * * * * * *'
- type: tcp
  id: myhost-tcp-echo
  name: My Host TCP Echo
  hosts: ["myhost:777"]  # default TCP Echo Protocol
  check.send: "Check"
  check.receive: "Check"
  schedule: '@every 5s'
- type: http
  id: service-status
  name: Service Status
  hosts: ["http://localhost:80/service/status"]
  check.response.status: [200]
  schedule: '@every 5s'
heartbeat.scheduler:
  limit: 10
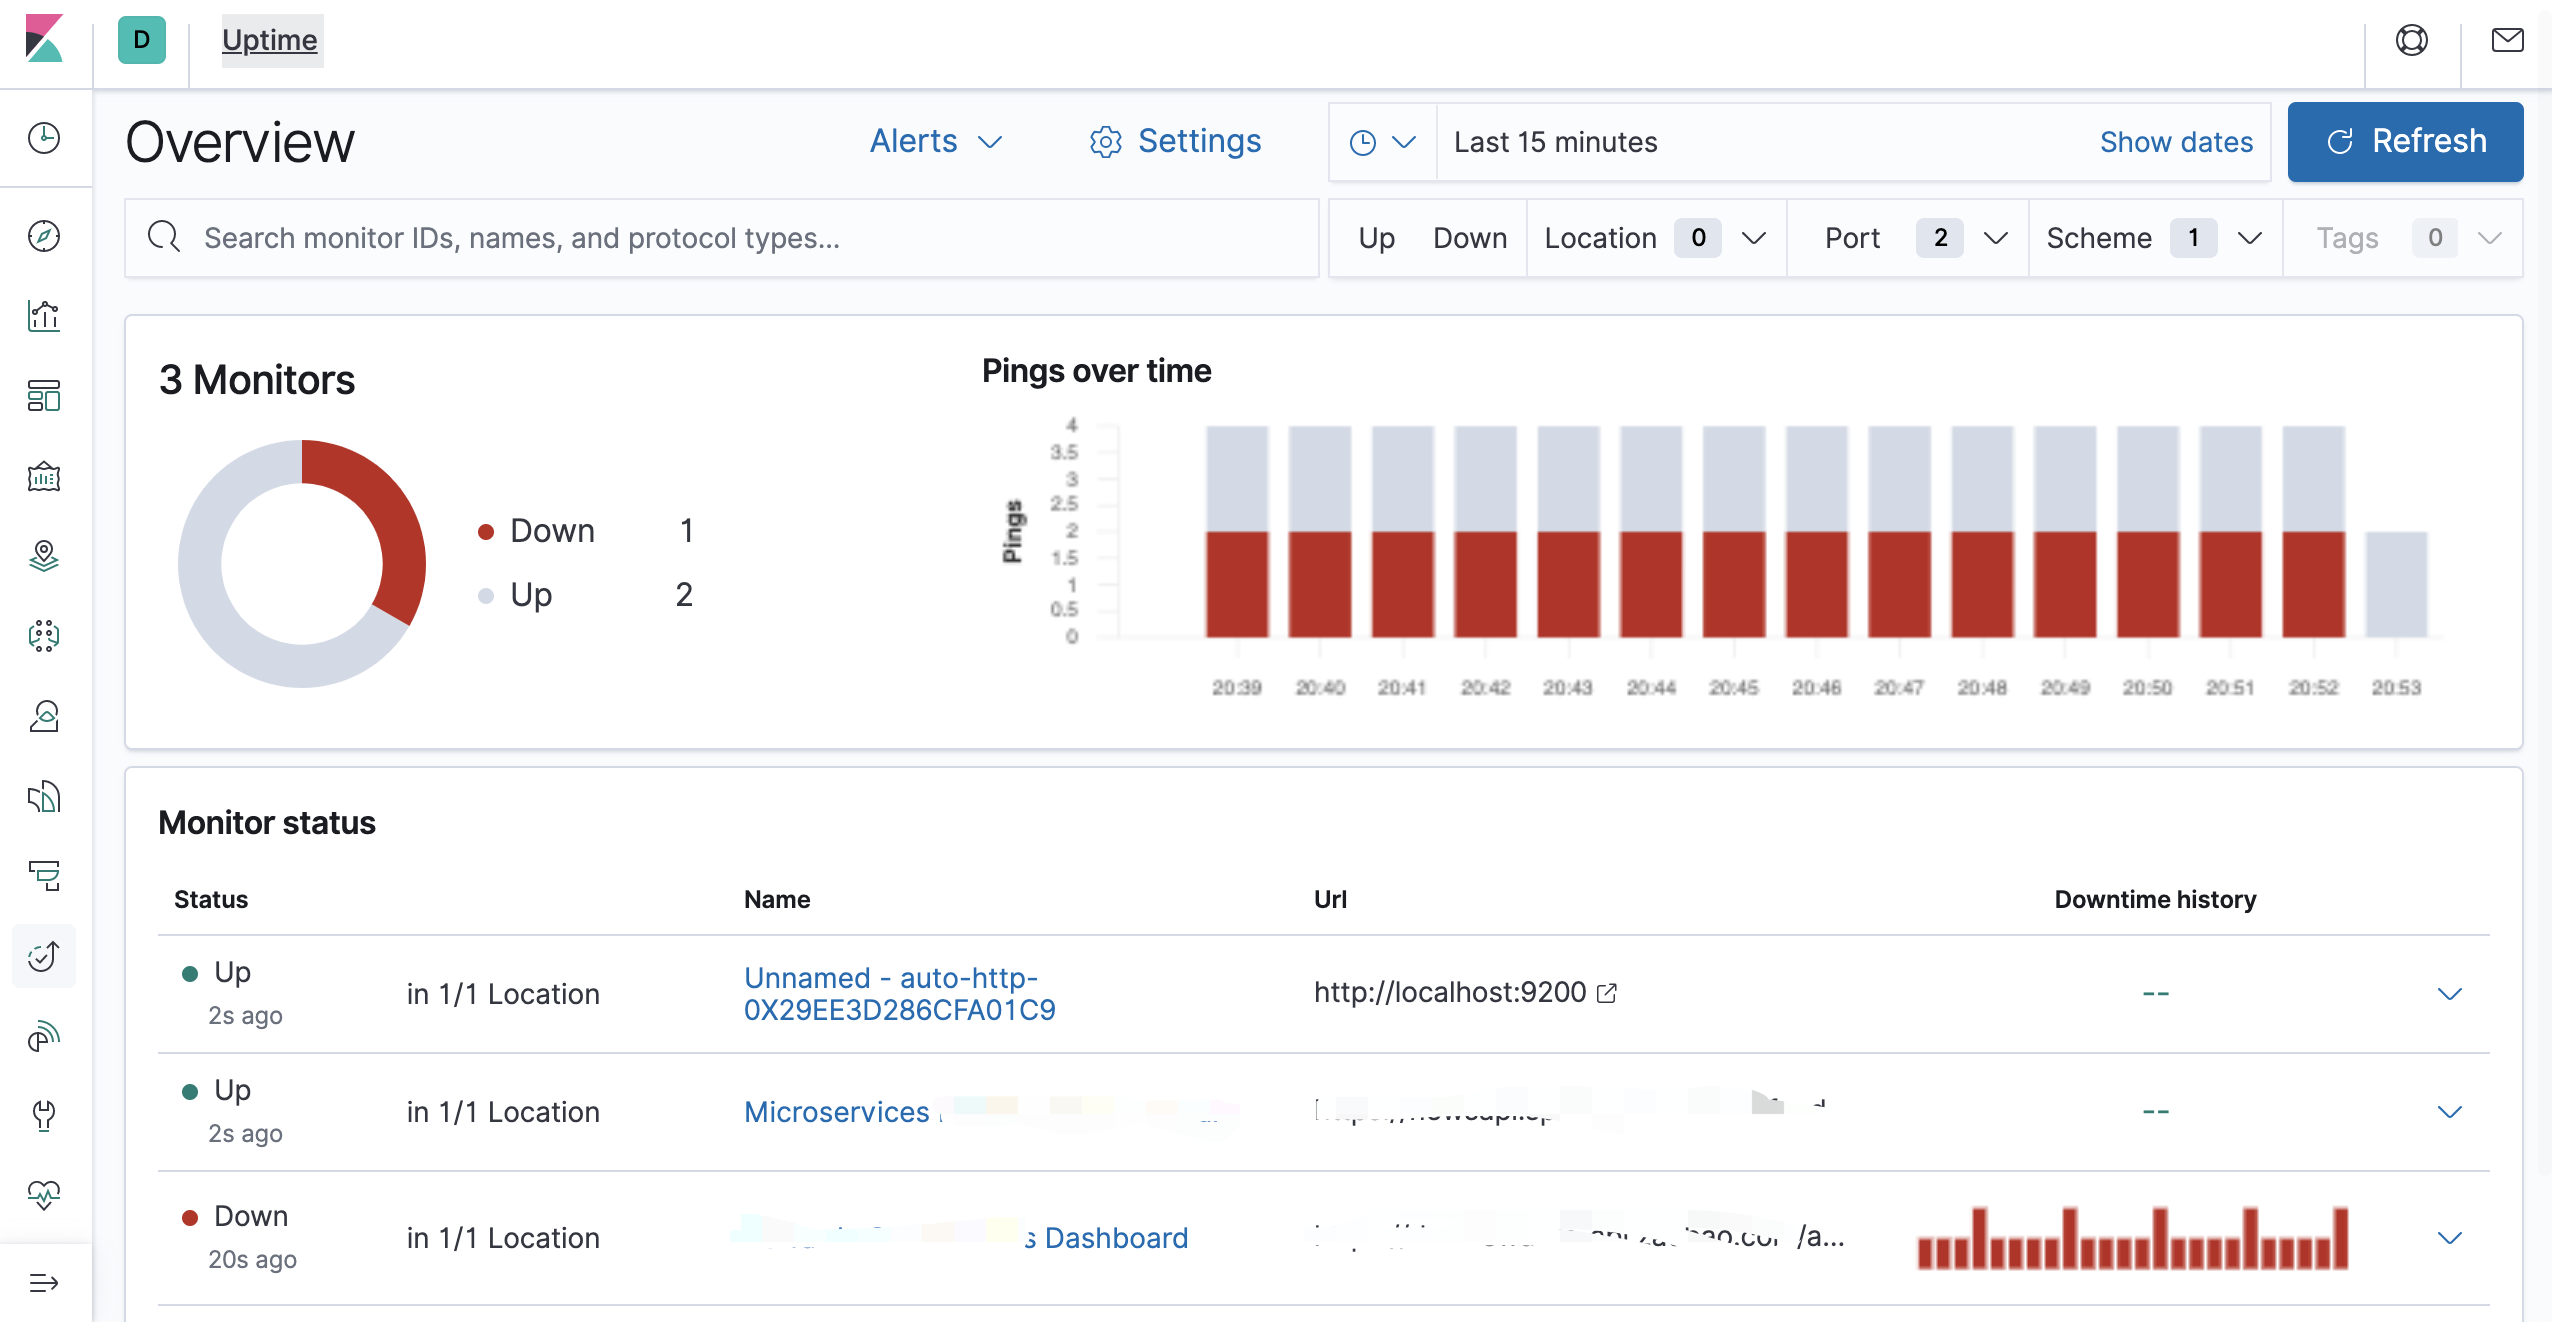
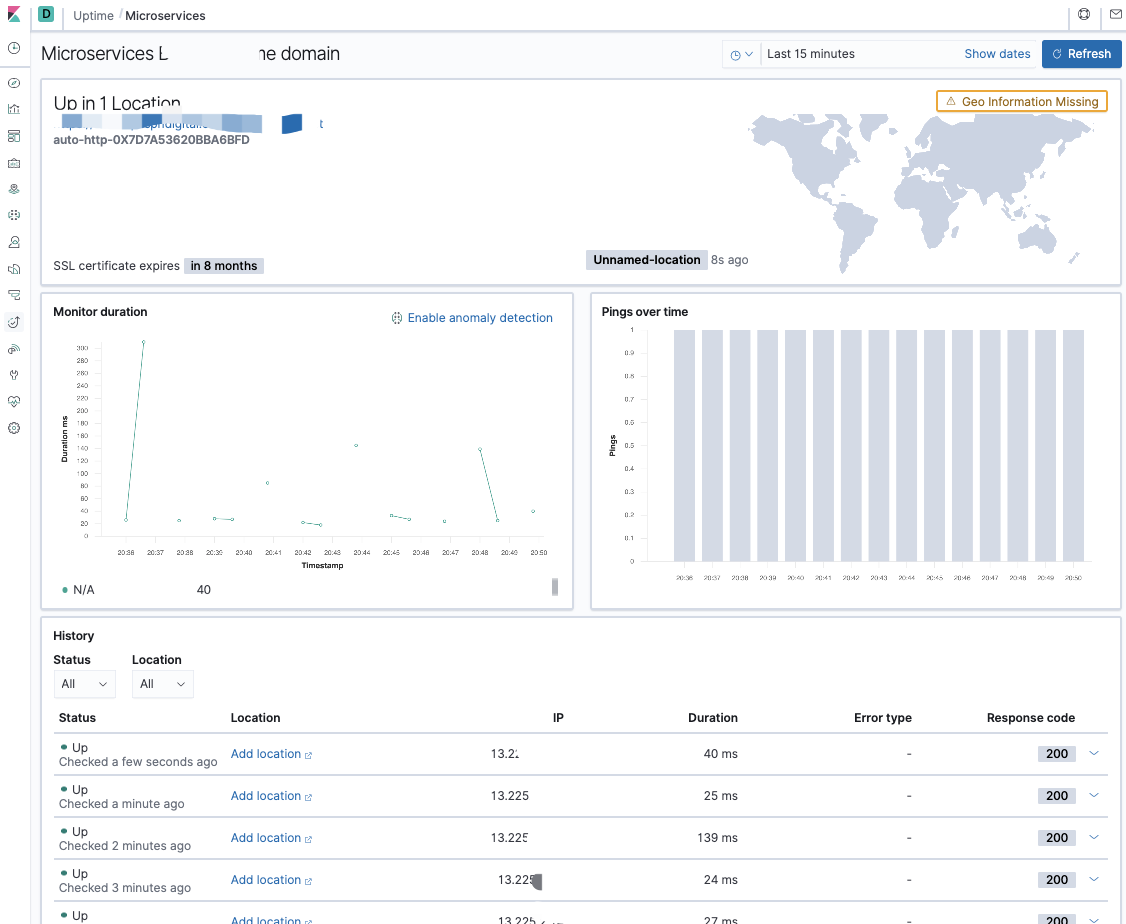
效果如下
References:
Monitor your private internal endpoints 24×7 using CloudWatch Synthetics
Step2: Configure Heartbeat
Configure Heartbeat monitors